Climate
Management Approach
Lilly acknowledges that climate change is an ever-present reality that is contributing to a reduction in human and environmental health. Action against climate change is required to achieve the goals of the Paris Agreement and to avoid the most detrimental effects of climate change by limiting the global temperature rise to 1.5 °C. Lilly is taking action to reduce GHG emissions within our operations and along our value chain. We have assessed our Scope 3 emissions and progressed in our journey to identify climate-related risks and opportunities in our business.
As a global biopharmaceutical company, we recognize our responsibility to reduce our carbon footprint and manage climate-related risks and opportunities to support the transition to a low carbon economy. Lilly supports the Paris Climate Agreement, discloses information according to recommendations of the Task Force on Climate-related Financial Disclosures (TCFD) and strives to implement these recommendations across the TCFD categories of Governance, Strategy, Risk Management and Metrics & Targets. For more information, please see our TCFD metrics.
2030 Climate Goals and Our Progress to Date
Lilly is committed to reducing our GHG emissions, and prioritizing energy efficiency to become a more climate-resilient organization. We have set climate goals for 2030 as we work toward contributing to a low-carbon economy:
Secure 100% of our purchased electricity from renewable sources
Through the end of 2022, 95,700 MWh representing roughly 14.4% of our purchased electricity came from renewable sources.
In 2022, we joined RE100, focusing our efforts to bring renewable electricity onto the grid, using a three-pronged approach.
The first, and most effective effort, is implementing direct renewable electricity through on-site installation. We have established on-site solar arrays at our sites in France, Ireland, India and Spain. On-site solar contributed to approximately 2,200 MWh of electricity generation representing roughly 0.34% of our purchased electricity. In addition, we are in the construction phase of a new solar array at our site in Puerto Rico, an expansion of our solar array in Ireland, and evaluating several additional on-site renewable energy projects.
Second, we are purchasing renewable energy from our utility providers across our sites in Spain, Ireland, Germany and Switzerland. We purchased roughly 63,700 MWh of renewable electricity, representing 9.6% of our purchased electricity.
Third, we are purchasing Renewable Energy Certificates (RECs) in regions that are connected to the same grid as our operations. For 2022, we purchased 29,800 MWh of RECs through our utility provider in the U.S., representing 4.5% of our purchased electricity.
Recent Achievements
Reducing Energy and Emissions
In 2022, our energy consumption remained flat compared to 2021. Although consumption remained flat, we have transitioned to cleaner and more efficient technologies that help reduce greenhouse gas emissions associated with this energy. We continued to emphasize reducing energy consumption and driving energy efficiency at our facilities.
We continue to evaluate how to improve our energy resiliency and expand our use of renewable electricity consistent with our goal to diversify our energy sources and decrease our GHG emissions over time. Our current initiatives include:
Designing for energy efficiency and sustainability using Leadership in Energy and Environmental Design (LEED) principles in new and updated facilities.
Evaluating energy efficiency opportunities across our facilities, equipment and operations.
Facilitating the use of advanced energy monitoring and control solutions.
Conducting energy assessments, energy audits and implementing recommended projects to improve energy efficiency.
Evaluating and incorporating alternative energy sources, new technologies, and best practices for energy use and GHG emission reductions.
Participating in local, regional, and national forums to understand and integrate energy management best practices and to support responsible and cost-effective decision-making and policy development (e.g., the U.S. Environmental Protection Agency’s ENERGY STAR Pharmaceutical Focus Group, the Association of Energy Engineers, and the American Society of Heating, Refrigerating, and Air-Conditioning Engineers).
Reducing Emissions through Cleaner Energy
We continue to evaluate how to improve our energy resiliency and expand our use of renewable electricity consistent with our goal to diversify our energy sources and decrease our GHG emissions over time.
- Fegersheim, France – In 2022, Lilly started up a new 20,000 square-meter parking canopy solar array in Fegersheim, France, that allows the manufacturing site to directly produce about 12% of its electrical energy needs through sustainable power. Additionally, the site installed 72 charging ports for electric vehicles.
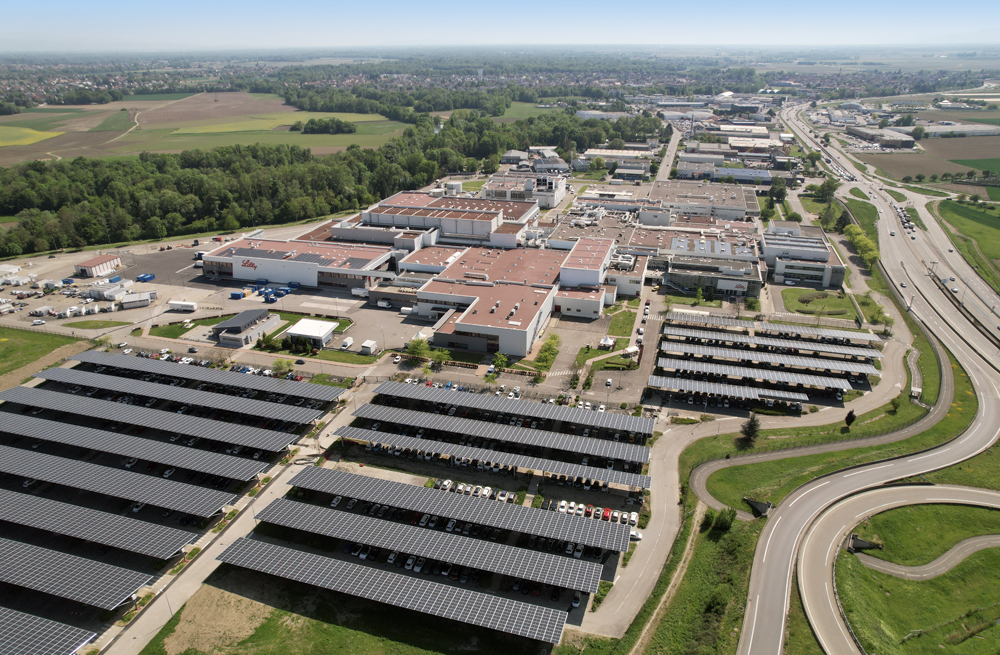 Parking canopy solar array at Lilly’s Fegersheim, France location.
 - Kinsale – In 2021, Lilly started up a 20-acre solar array in Kinsale, Ireland, consisting of over 12,600 solar panels, which at the time of construction represented the largest solar development in Ireland. The solar array is expected to provide up to 15% of the site’s purchased electricity, resulting in an estimated 2,350 tonnes reduction of greenhouse gas emissions annually. Additionally, Lilly Kinsale has begun a 10-acre expansion of the site’s solar array, which is anticipated to be online in 2023.
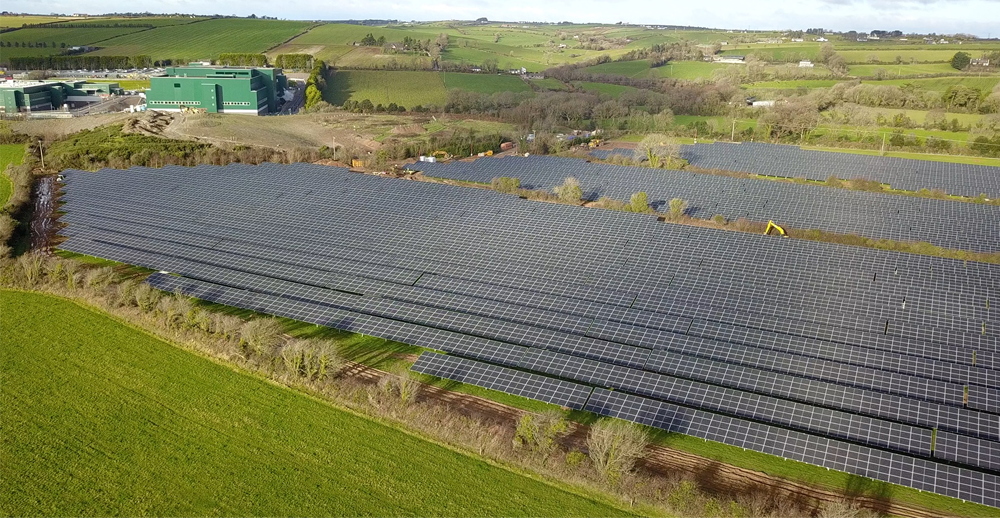 Solar field at Lilly’s Kinsale, Ireland location.
 - India – In 2019, Lilly India began operating a rooftop solar array on its administrative building in Gurugram (Gurgaon), India. The 40-kilowatt capacity solar panels will help reduce Lilly’s carbon footprint in the city – a key priority due to rising pollution levels. The solar panels supply approximately 10% of the site’s energy needs.
- Manufacturing facilities in Fegersheim, France and Sesto, Italy have solar arrays of 62-kilowatt and 145-kilowatt, respectively. Additional solar capacity is being installed at our manufacturing facilities in Puerto Rico and Fegersheim.
OffSetting through Carbon Removal Projects
While our primary strategy is to directly reduce emissions and replace carbon-intensive sources with clean energy sources where possible, to achieve carbon neutrality we recognize the remaining emissions will need to be offset by purchasing certificates from climate protection projects with recognized quality standards. In 2022, we did not purchase any carbon offsets. The decision to purchase offsets will be made based on the remaining emissions that cannot be eliminated.
Climate Performance Data
Greenhouse Gas Emissions (Location-based) (1)
|
2019
|
2020
|
2021
|
2022
|
|---|---|---|---|---|
|
Greenhouse Gas Emissions (Scope 1 and Scope 2) (metric tonnes CO2e) 2
|
2019:
788,000
|
2020:
710,000
|
2021:
645,000
|
2022:
586,000
|
|
Scope 1
|
2019:
192,000
|
2020:
159,000
|
2021:
157,000
|
2022:
171,000
|
|
Scope 2
|
2019:
596,000
|
2020:
551,000
|
2021:
488,000
|
2022:
415,000
|
Greenhouse Gas Emissions (Market-Based) (1)
|
2019
|
2020
|
2021
|
2022
|
|---|---|---|---|---|
|
Greenhouse Gas Emissions (Scope 1 and Scope 2) (metric tonnes CO2e)2
|
2019:
Not previously reported
|
2020:
Not previously reported
|
2021:
623,000
|
2022:
545,000
|
|
Scope 1
|
2019:
Not previously reported
|
2020:
Not previously reported
|
2021:
157,000
|
2022:
171,000
|
|
Scope 2
|
2019:
Not previously reported
|
2020:
Not previously reported
|
2021:
466,000
|
2022:
374,000
|
Value-Chain Greenhouse Gas Emissions
|
2019
|
2020
|
2021
|
2022
|
|---|---|---|---|---|
|
Scope 3 Emissions (metric tonnes CO2e)3
|
2019:
235,000
|
2020:
176,000
|
2021:
2,987,000
|
2022:
3,179,000
|
Energy
|
2019
|
2020
|
2021
|
2022
|
|---|---|---|---|---|
|
Total Energy Consumption (million BTUs)
|
2019:
6,400,000
|
2020:
6,200,000
|
2021:
6,100,000
|
2022:
6,130,000
|
|
Direct Energy Consumption (million BTUs)4
|
2019:
1,690,000
|
2020:
1,700,000
|
2021:
1,600,000
|
2022:
1,950,000
|
|
Indirect Energy Consumption (million BTUs)5
|
2019:
4,700,000
|
2020:
4,500,000
|
2021:
4,500,000
|
2022:
4,180,000
|
|
Renewable Electricity
|
2019:
Not previously reported
|
2020:
7.0%
|
2021:
9.6%
|
2022:
14.4%
|
Climate Goals
|
2030 Goal
|
2022 Performance
|
|---|---|---|
|
100% Renewable Electricity
|
2030 Goal:
100%
|
2022 Performance:
14.4%
|
|
Carbon Neutral (Market-Based Scope 1 and Scope 2)
|
2030 Goal:
Carbon Neutral
|
2022 Performance:
545,000 tonnes CO2e
|
|
Enhance Tracking and Reporting of Full Value-Chain Emissions (Scope 3)
|
2030 Goal:
N/A
|
2022 Performance:
On track
|
Footnotes
Note: Some segments do not add up to totals due to rounding.
Note: Bureau Veritas was engaged by Eli Lilly and Company to provide limited assurance in relation to specified 2022 environmental performance data presented.
A location-based method reflects the average emissions intensity of grids on which energy consumption occurs (using mostly grid-average emission factor data). A market-based method reflects emissions from electricity that companies have purposefully chosen (or their lack of choice). It derives emission factors from contractual instruments, which include any type of contract between two parties for the sale and purchase of energy bundled with attributes about the energy generation, or for unbundled attribute claims. See GHP Protocol Scope 2 Guidance.
Includes Scope 1 emissions and energy from onsite fuel combustion, refrigerants, process emissions and mobile combustion sources; and Scope 2 emissions and energy from site-purchased energy (i.e., electricity, steam and chilled water). For smaller locations not billed directly to Lilly, data are estimated based on square footage.
2020 Scope 3 data include the following Scope 3 categories: upstream transportation and distribution, waste generated in operations, business travel, employee commuting, upstream leased assets, downstream leased assets, franchises, investments. From 2021, all 15 categories within the Scope 3 emissions have been assessed, verified and reported.
Data includes energy from combustion of coal, fuel oil, natural gas and liquid propane. Does not include energy used by aircraft, sales fleet or on-site generated renewable electricity.
Data includes energy from purchased electricity, steam and chilled water.
View Lilly’s environmental data from 2020, including our previous goals and progress through 2020. Additional historical data are available in our reporting archives.
Explore our Environmental Goals and Progress


See important information about our ESG report.